Sweed’s new 2026 Q1 Loyalty Benchmark Report: The Revenue Impact of Loyalty for Modern Dispensaries is officially live, and the headline is difficult to ignore: loyalty members accounted for 81.7% of active customers and generated 89.4% of total revenue in Q1 2026.
But despite enrollment growing approximately 35% year over year, fewer than one in four new members earn their first loyalty point, and just 6.6% reach their first redemption.
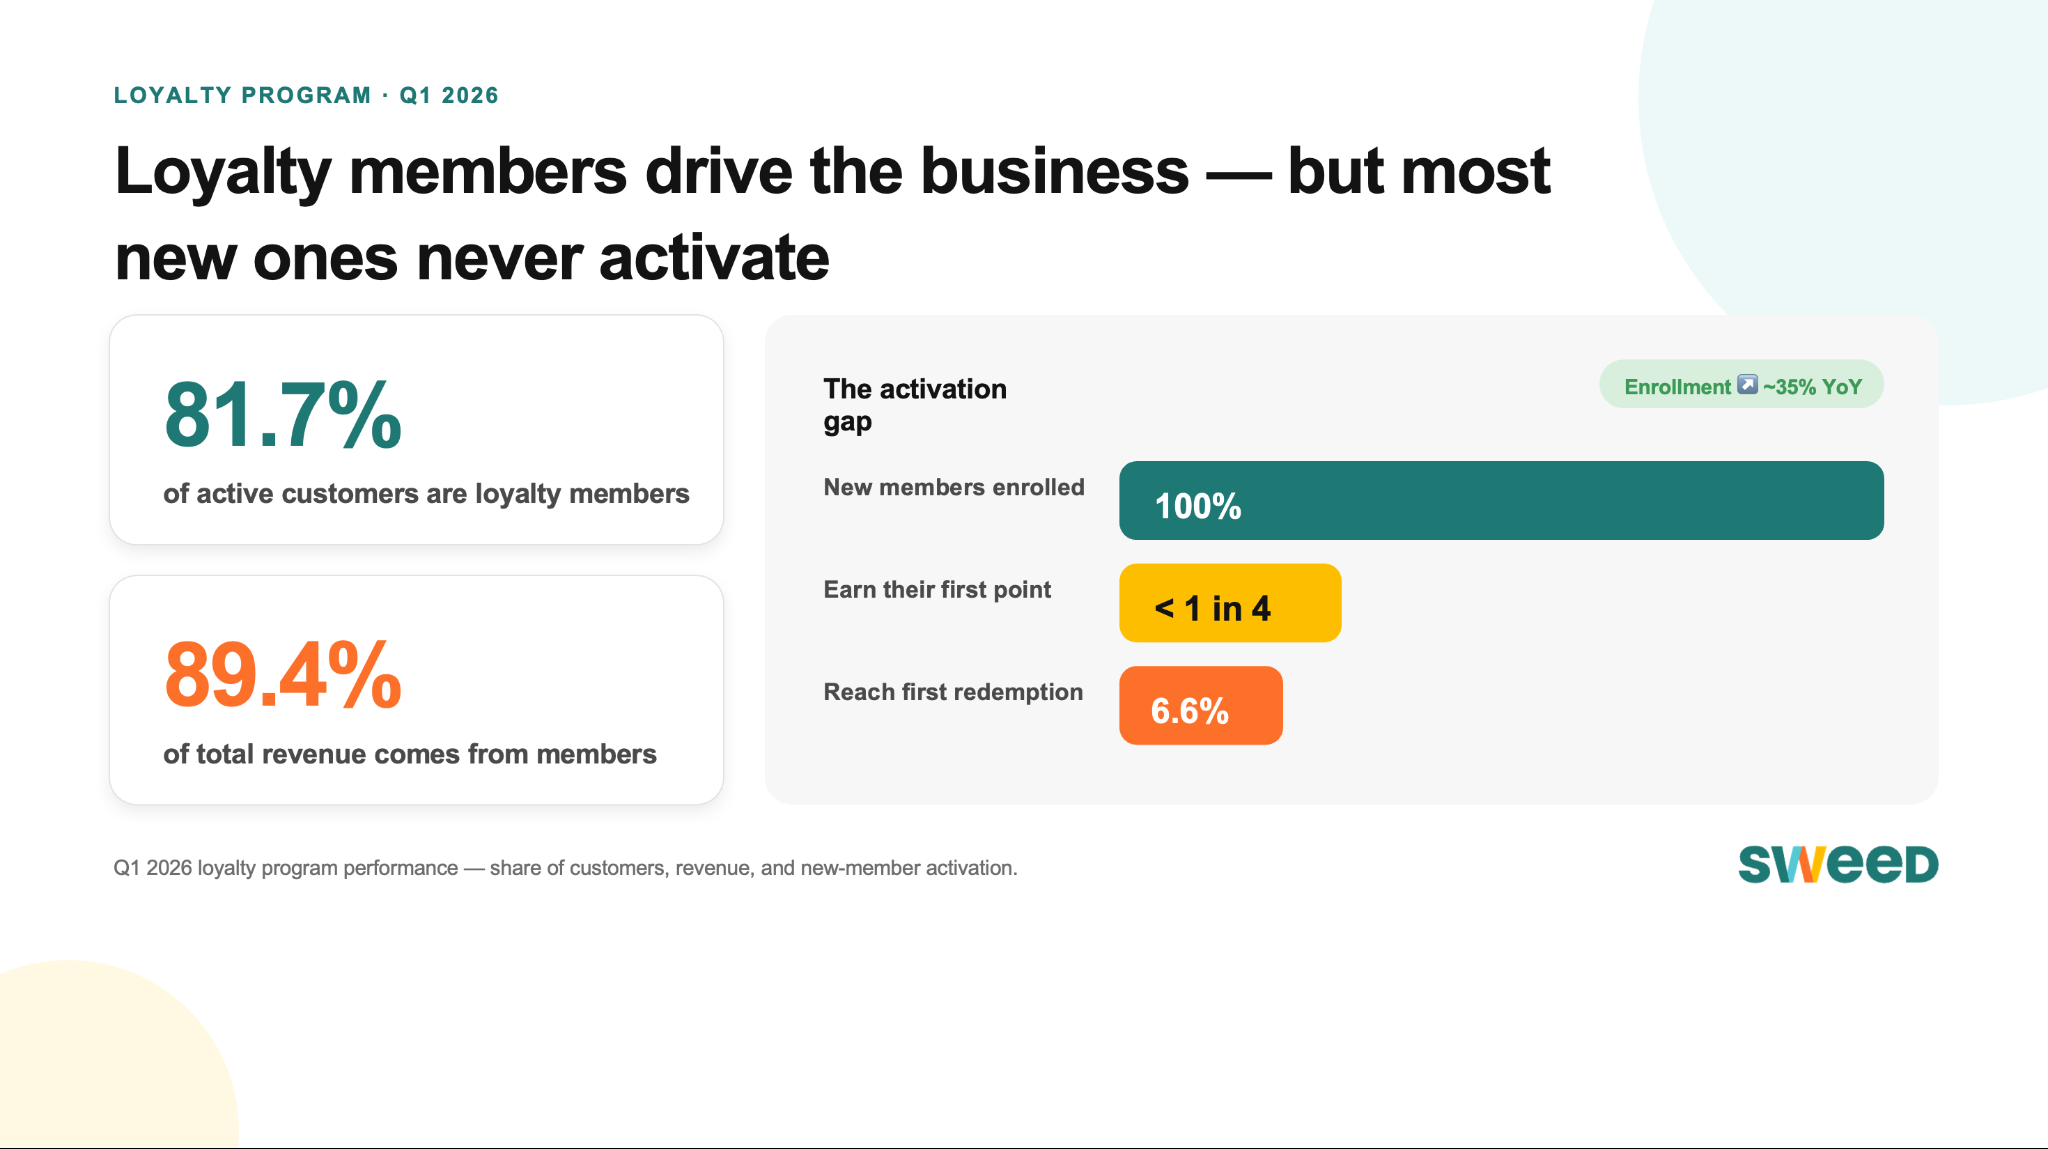
That gap tells the real story. Simply collecting phone numbers at checkout is no longer a growth strategy. It’s a starting point.
The Power of Loyalty Members
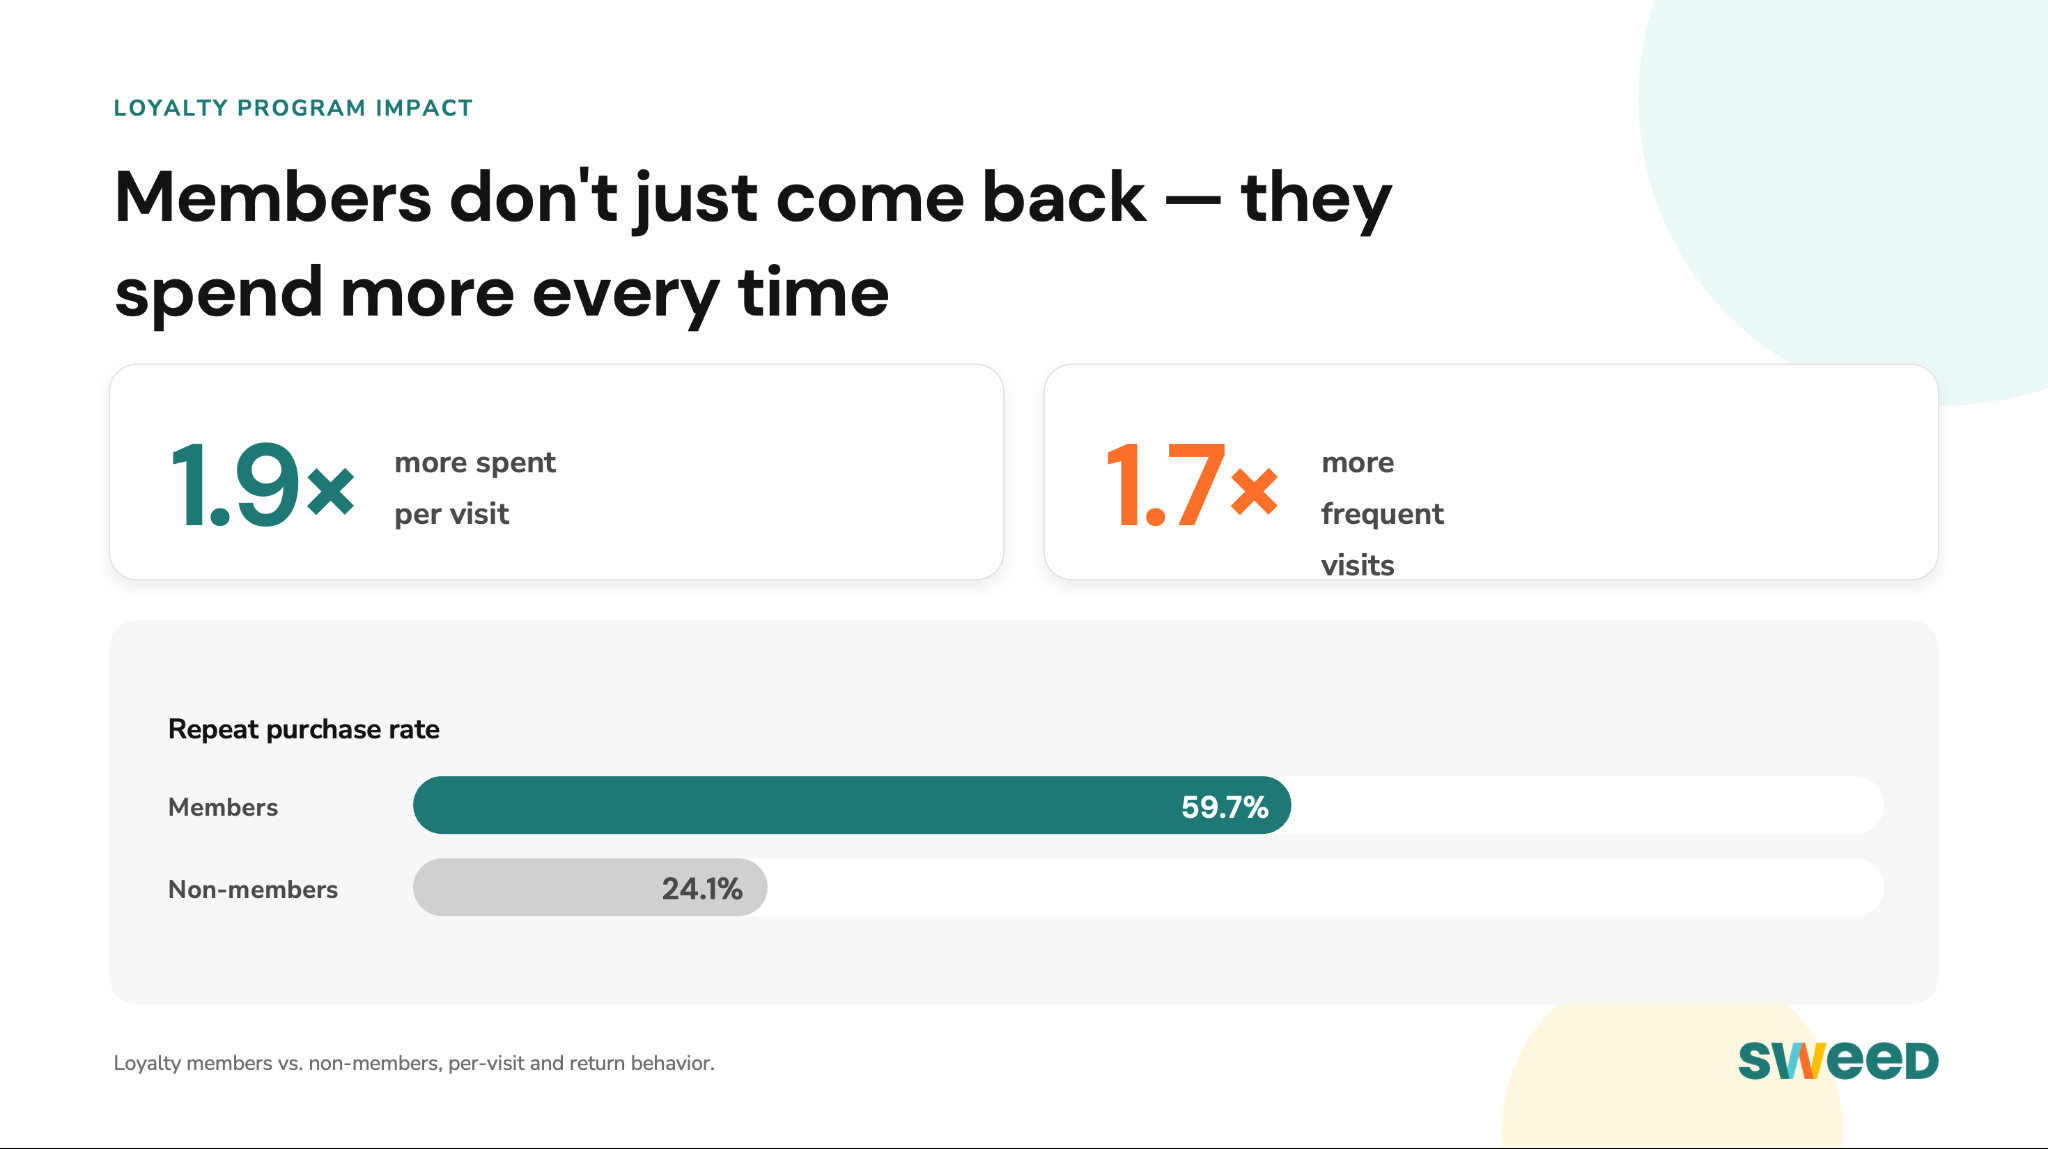
The data makes the economic case of loyalty impossible to dismiss. Compared with non-members, loyalty members spent 1.9x more per visit and visited 1.7x more frequently. Their repeat purchase rate was 59.7%, versus 24.1% for non-members.
But those numbers only materialize when customers are given enough value to return, redeem, and build a habit around your store. In an industry where customer acquisition is constrained by regulations and limited capital, understanding the gap between enrollment and activation isn’t academic… It’s necessary.
One more data point worth sitting with: email reach was 81.3% for loyalty members, compared with 26.2% for non-members. Your loyal customers are captivated. The real test is speaking to that audience in a way that gets them through your doors, and keeps them choosing you, over and over again.
The Biggest Leak Happens After Enrollment
Q1 saw meaningful enrollment growth. But the data also shows that many customers stall after the initial sign-up, particularly in the journey from activation to first redemption.
This is the moment that matters. A customer who joins but never earns, understands, or redeems a reward isn’t engaged, they’re just a name in a database. The programs that turn enrollment into repeat revenue make the next action obvious: earn points, unlock a welcome benefit, make progress toward a tier, use a reward that feels worth returning for.
The report gives operators a practical way to examine the funnel, and highlights the levers that actually drive repeat customers.

Enrollment Rate vs. Redemption Rate: Where Does the Journey Break Down?
The findings are clear: loyalty program enrollment is a critical starting point, but it’s a small portion of enrolled customers who are actually moving the bottom line.
So if your repeat rate, redemption behavior, or communication reach lags the benchmark, it’s worth asking: where does the journey break down? If enrollment is strong but member spending isn’t growing, are your rewards simple, visible, and compelling? If high-value customers aren’t progressing, have you given them a reason to?
The full report breaks down the numbers and the opportunities behind them, helping retailers see where loyalty is already creating value, and where the next gains may be hiding.


-Cannabis-Retail-Dispensary.svg)
%201.svg)